

DataLiner: A Global Trade Database for Smarter Logistics
Comprehensive Trade Data to Drive Smarter Business Decisions
South America’s Most Trusted Trade Data Source
Built on DataLiner—our global trade database—this business intelligence system delivers fast, flexible access to South American maritime trade data. Our BI tools, linked to our international trade database, let you visualize, filter, and export & import data by country, commodity, port, carrier, and company—enabling users to run self-serve data analysis and make informed decisions across the logistics chain.
Our database has over 200 fields of regularly updated data at your fingertips so you can:
Grow your client base
Find new market opportunities
Monitor market share
Track competitor activities
Streamline your logistic chain
Unlock the full potential of your trade data with DataLiner.
Choose The Right Tool to Fit Your Need
One database, four business intelligence BI modules—pick the business intelligence tool that answers your question.
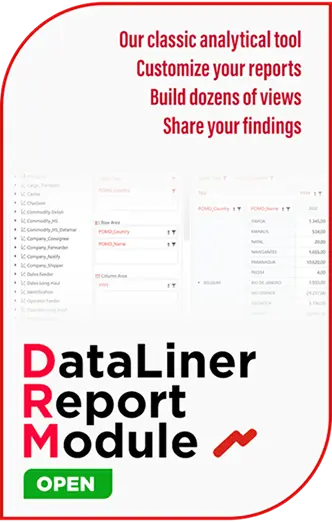
DataLiner Report Module
DataLiner Report Module is our CLASSIC ANALYTICAL TOOL! Use it to generate holistic reports and to find trends. Customize each analysis to build dozens of different reports - each seeking to provide the SOLUTION you require. This is the place to save your Rankings, Market Share reports and much more!
Features it includes
Access Anywhere, Anytime
Effortless Report Creation
Export your reports
Unlimited data searches
Analytical tool to obtain market insights
Save all report filters within app
Create refreshable market share and ranking views by HS code, port, carrier, or company. Compare export import data by country and drill from trends to shipment-level detail. And combine broad analysis with granular BL data for board-ready reporting.
DataLiner Report Module
Search Records
Search Records is our easy LOOK-UP TOOL. Ideal for finding those records that you need to take a closer look at. Create and save your QUERIES and VIEWS. Customize them with whichever fields you want to see. Track those records that are of interest to you every time the database is updated. And don't forget to check the Top 10 Rankings of Companies, Commodities and much more!
Some of its features
Access in your web browser
Historical data included
Updated weekly
Save all report filters within app
Unlimited data searches
Data download functionality
Instantly locate individual Bills of Lading, verify suppliers, and export to Excel to accelerate due diligence and decision-making.
Search Records

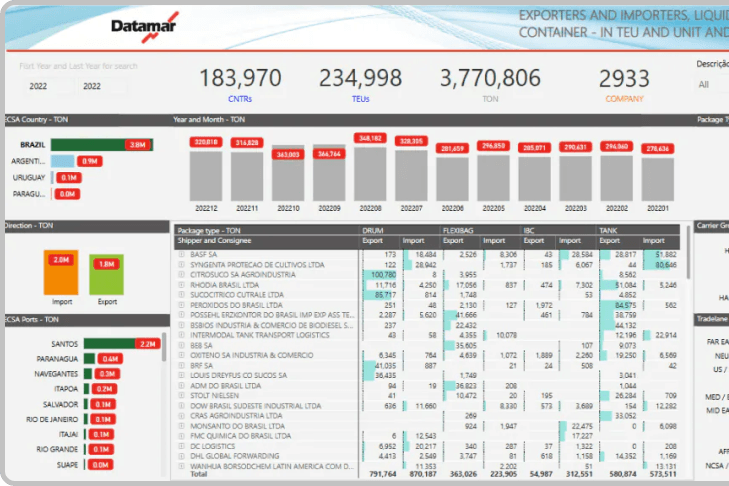
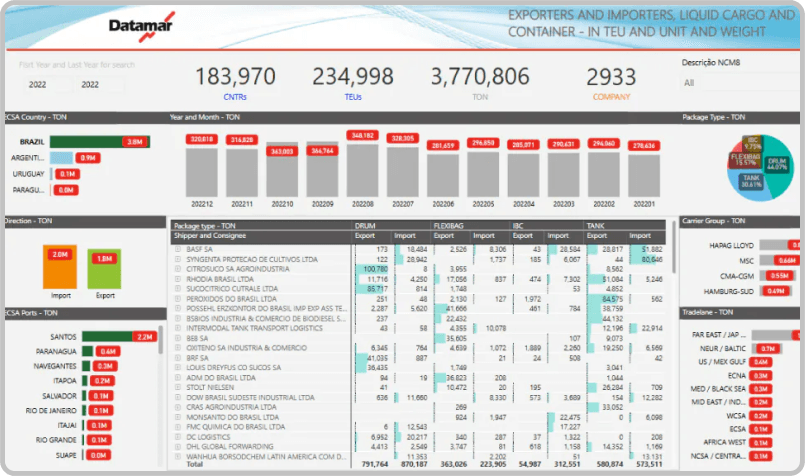
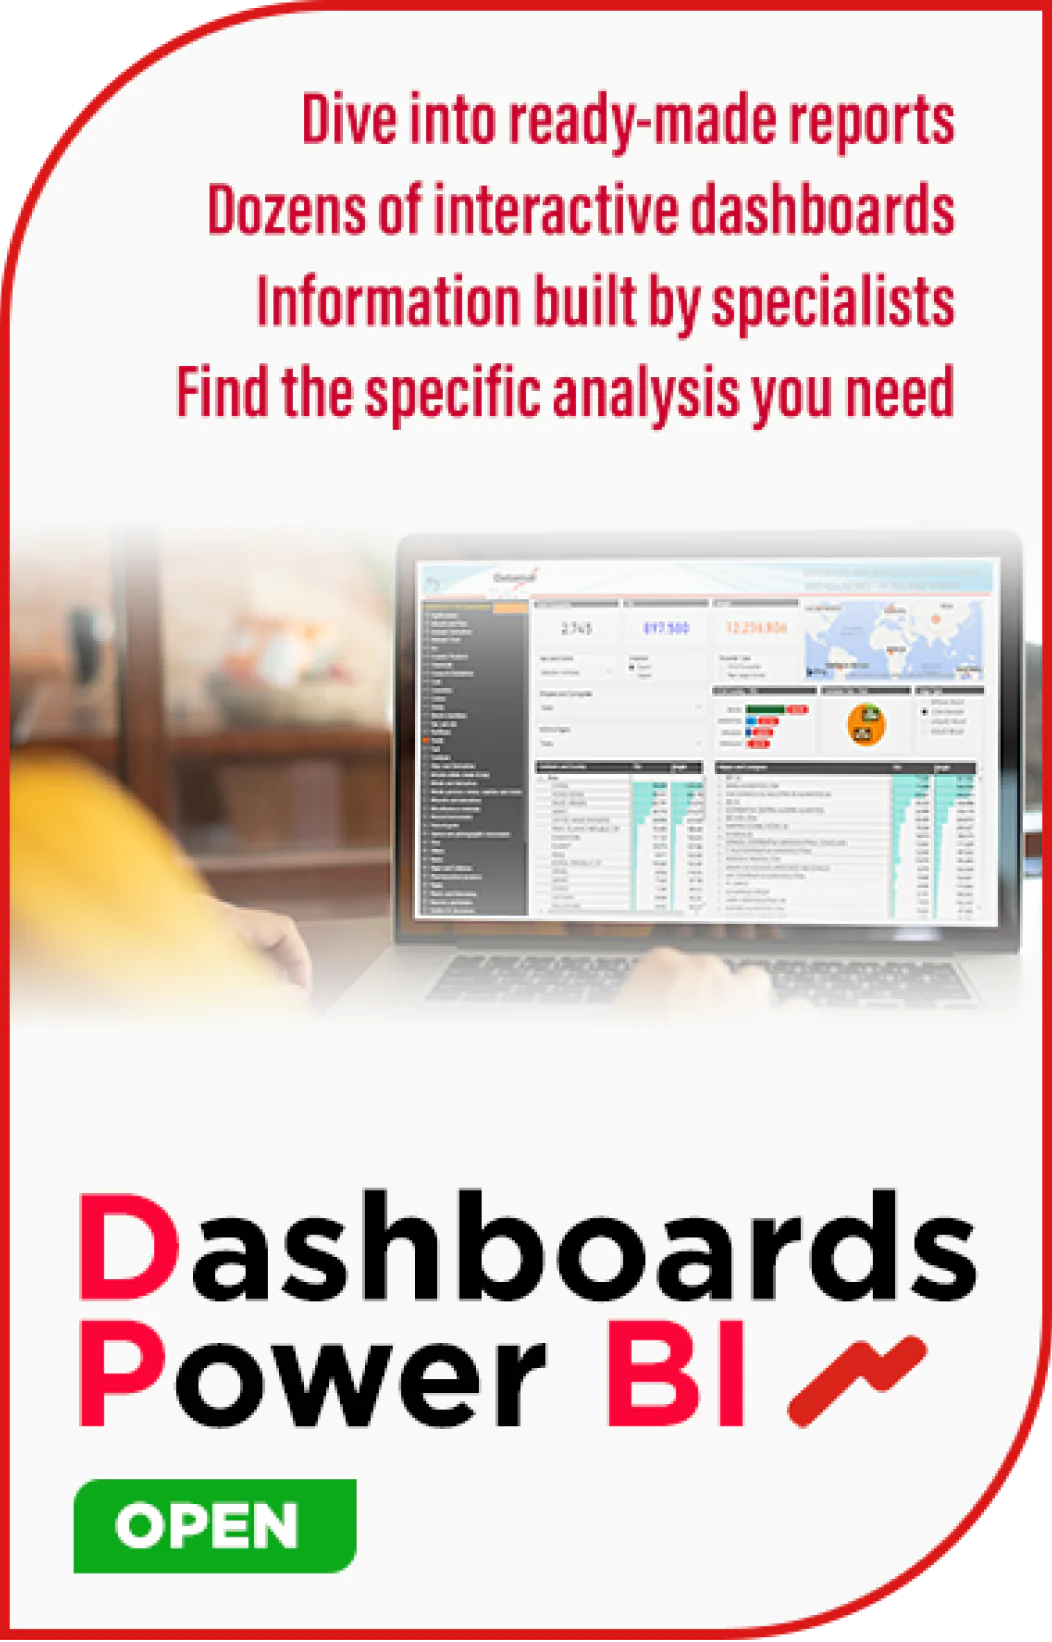
Dashboards Power BI
Immerse yourself in ready-made reports. Datamar has built dozens of interactive dashboards with diverse information assembled for specific types of analysis. All assembled by our experts. Find the analysis you need.
Some of its features
Instant Insights, No Setup Needed
Comprehensive Trade Dashboards
Interactive dashboards
Unlimited data searches
Get custom reports built for you
Executive-ready Power BI dashboards help you data visualize import volumes, routes, and market share at a glance—ideal for leaders who need clear KPIs without spreadsheets.
Dashboards Power BI
Company Profiles
With the click of a button, access comprehensive reports of thousands of companies and their global movements. The information considers the last 12 months of data in the analyses, avoiding seasonality problems.
Some of its features
Company Structure Breakdown
Key Trade Routes by Company
Year-To-Date (YTD) analysis
Top Products & Commodities Traded
Company's latest shipments
Major Trading Partners by Commodity
Benchmark against industry leaders, map supplier–customer networks, and identify new partners using verified, company-level trade data.
Company Profiles

Trade Data Across Border
When analyzing markets from different countries, it is so
important to be able to compare 'apples with apples' to reach
meaningful conclusions. This is what our business intelligence
system allows so that you can confidently study, compare and
contrast data from the following countries: Brazil, Paraguay,
Uruguay, Chile, Argentina and Peru.
Standardized methodologies
let you compare export import data by country in a single view,
ensuring apples-to-apples analysis across South America.
Trade Data Across Border


Request a demo
Send a request. We will be delighted to help you.
See how our BI tools and dashboards work together—request a live walkthrough and sample outputs to start making informed decisions today.